Cultural Context Helps Explain Why World Leaders Have Such Different Responses to Coronavirus Pandemic Data
It’s early-May in South Korea. After months of combatting Covid-19, the streets of Seoul and Busan are coming back to life. Infection rates are down and the government is relaxing social-distancing guidelines. Korean scientists, government, and business leaders are cautiously optimistic. They watch the charts like hawks while the words of Woo-joo Kim (김우주), Professor of Infectious Diseases at the Korea University College of Medicine – the nation’s top public health expert – repeat over and over again in their minds:
“The moment we become arrogant, we will lose. We have to be humble until the end. It’s not the end until it is over.”
Fast forward three weeks. The tides turn again: On May 27th, the number of daily new cases spikes from 19 to 40. The next day it’s 79. Uh oh. We’ve seen this trendline before…
But then something remarkable happens – the spike stalls out. The number of daily new cases starts trending downward: 58.. 39.. 27.. Over the next 45 days (up to the time of this writing), the number of daily new cases in South Korea remains between 17-67.

Meanwhile, in the United States, an entirely different story is unfolding:
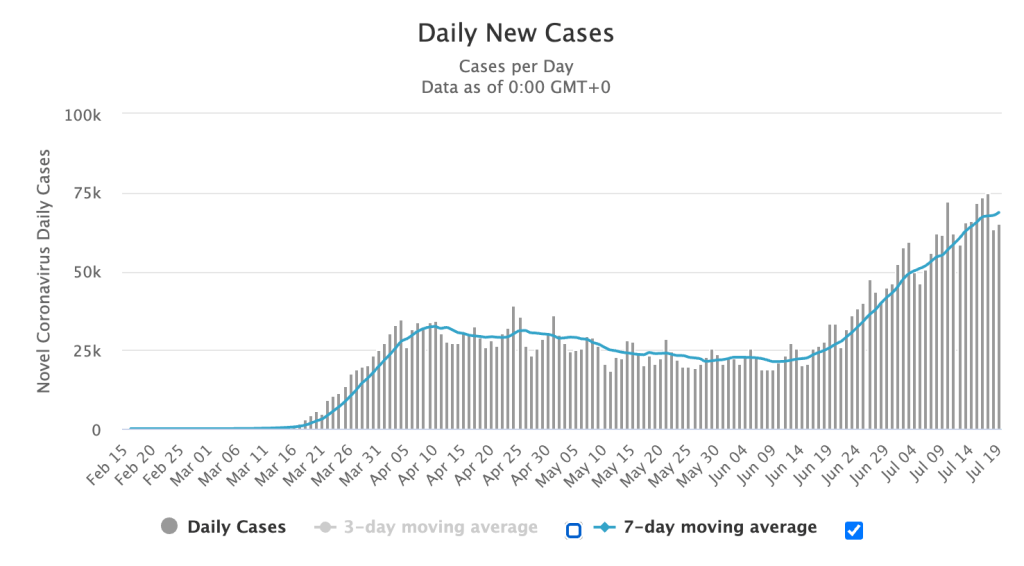
Take note of the difference in scaling (Y-axis). If you overlay the South Korea chart, it hardly even registers.